Analyze the right metrics - How to use Custom User Timings in Webpagetest
- Published at
- Updated at
- Reading time
- 6min
Web performance tools increasingly become more and more popular. I gave a talk at several user groups and meet ups here around Berlin that showed which tools are available, what setup is needed and what the benefit of using these tools might be.
When presenting the current tooling landscape the question of how to use all these great tools for a single page application came up several times. Getting meaningful metrics for single page applications is hard because the metrics that browsers provide these days do not offer much value. Events like DOMContentLoaded or load are a good way to indicate how a page performs but give no hint on how the actual user experience is. In 2013 Steve Souders already noticed the lack of proper metrics and has since emphasized the importance of developing more meaningful metrics.
One big improvement that took place is the Speed Index provided by Webpagetest. It is a metric that tries to solve the problem of measuring user experience by providing more meaningful data. It uses the visual progress of visible page loading and computes an overall score for how quickly the content painted. This is great to get an idea of how fast content is displayed to the visitor and at which point the visitor can interact with the site.
When thinking of single page applications this is helpful but might not give you the needed or even correct information in terms of user experience. The way single page applications work is usually that all assets are served and afterwards a whole chain of XHR requests is started to fetch remaining needed data. It is quite usual that your application is only ready when some key requests are done. This timing is something you should be particularly interested in. You always have to remember that you know best what actions are important and when your site is ready to use. A great example for the usage of custom metrics is Twitter with their "Time to first tweet” metric which is their approach to understand their users and the goals these want to accomplish.
So how could we implement custom metrics in our development and measurement stack? It turns out that the User Timing specification is exactly what we are looking for. Using it developers are able to set PerformanceMarks and PerformanceMeasures to gather high precision timings of important events happening inside of their applications.
PerformanceMarks are timestamps associated with a given name and PerformanceMeasures are durations between set marks. If you are interested in these I highly recommend to check the spec that also offers code examples to get you going.
After setting your important marks and measures you can easily retrieve them by using window.performance.getEntriesByType( 'mark' ) or window.performance.getEntriesByType( 'measure' ). This data is perfect for sending it back to your server (a so called beacon) and perform some data analysis on it. If you are interested in this approach Nic Jansma wrote the good article called How to provide real user monitoring for single-page applications on this topic.
In case you use Webpagetest already there is a nice little feature not many people know. When setting marks using the User Timing Specification Webpagetest will automatically take these values and display these inside of the generated report — pure awesomeness!
Custom example TodoMVC monitored with Webpagetest To see this working I set up a local fork of the Angular implementation of TodoMVC. In case you don’t know TodoMVC it is a showcase of a simple to-do list implemented in many popular single page application frameworks. When starting discovering the world of single page apps this is definitely a good place to start your journey.
I created a dummy endpoint at mocky.io to simulate an asynchronous XHR request and set up ngrok to make my little local To-do list accessible from the outside and to run Webpagetest against it.
And then the fun part started. I set custom marks when the request finishes and implemented a timeout to simulate heavy data processing.
get: function () {
    return $http.get('http://www.mocky.io/v2/5560c5f958b174f4057eedd8')
        .then(function (resp) {
            // set first mark which
            // represents the finish of
            // this XHR call
            window.performance.mark('key_data_arrived');

            // set a timeout to simulate other
            // heavy operations that might go
            // on in a real world application
            $timeout( function() {
                angular.copy(resp.data, store.todos);

                // set second mark which
                // represents the finish of
                // processing this XHR call
                window.performance.mark('key_data_processed');
            }, 1000 );

            return store.todos;
        });
},
The timeout of one second leads to a heavy degradation in terms of user experience because it forces the application to show an empty to-do list for one second longer. As a user of a to-do list application I want to see my to-do’s and I want to see them as quickly as possible. This is clearly one of the key targets of this application and any delay in displaying the to-do list items might lead to frustration on visitors side.
So let’s check what happens when we run Webpagetest against this site including performance marks.
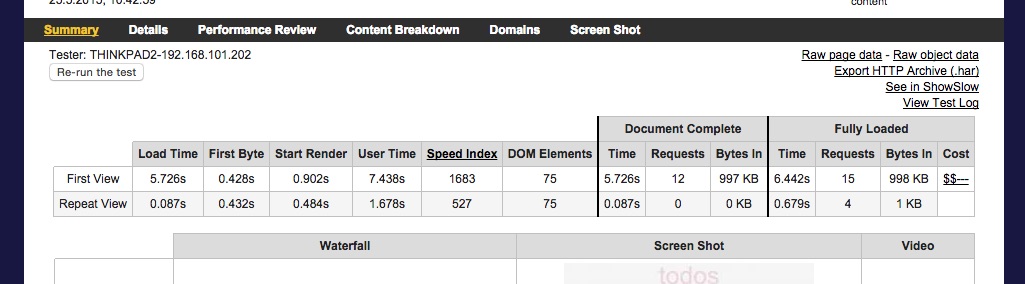
Looking at the summary panel we see a new Metric called “User Time". This metric represents the last custom set performance mark for the given site.
The comparison of “Start render” and the most likely recommended “Speed Index” and the last set mark is the key point here. The time difference is around six seconds depending on which values you compare. This is huge!
Getting a Speed Index of 1683 is a relative good value but compared to 7.7 seconds, representing the point when your application becomes useful to your customers, it is not giving any valuable information about user experience.
To dig into this a bit more I went over to the details panel.
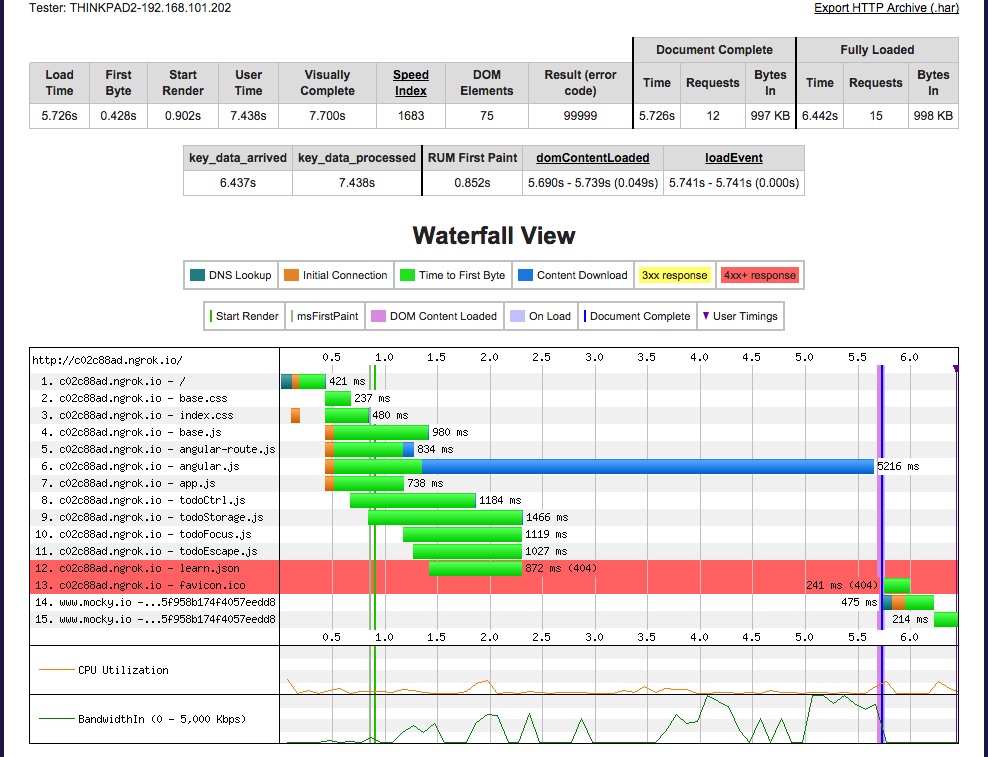
The details panel now shows all set marks separately and also marks them inside of the waterfall visualization.
One thing to mention is that Webpagetest seems to show events inside of the Waterfall in the details panel only as long as there is network activity going on. This is why we don’t see the key_data_processed event.
To see both of our marks I checked the filmstrip view which then also showed the second mark.
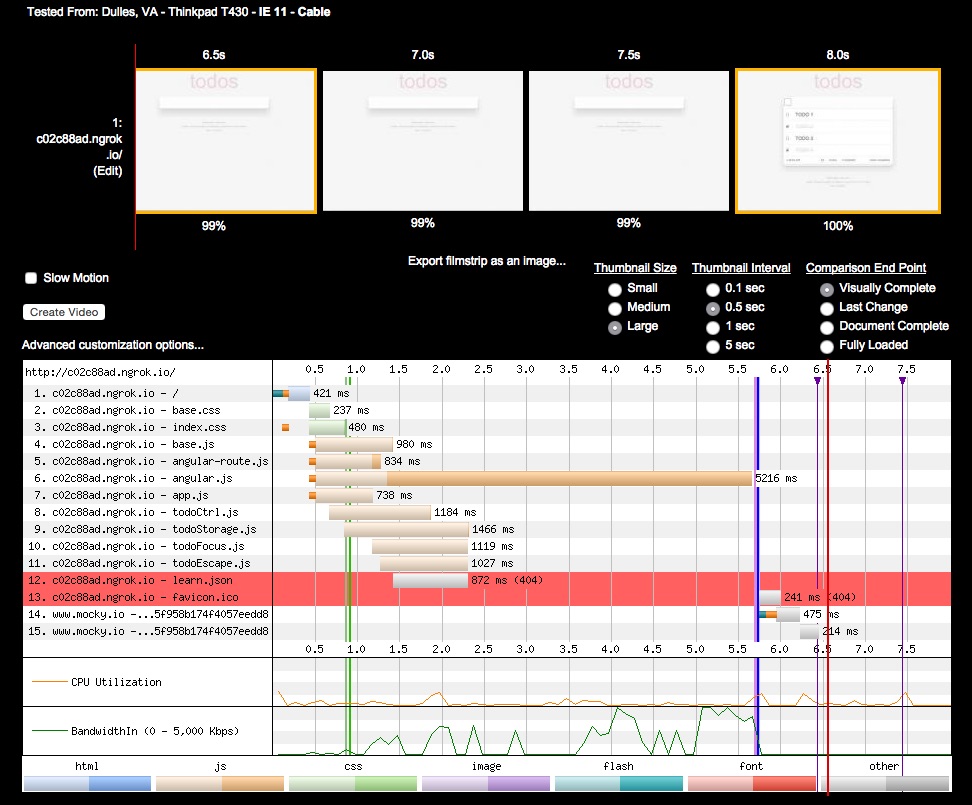
The filmstrip view is a great way to get a better idea of what network requests lead to visual changes on the site. Checking it for the to-do example shows very clearly at which point the application becomes useful, using custom marks we can also easily enrich the waterfall with additional events.
If you want to have look at the shown Webpagetest results yourself you can find them here.
Measuring the user experience of single page applications is a tricky thing and using available metrics can lead to misleading or completely wrong results as the comparison of Speed Index and the mark key_data_processed clearly shows. To do it right we all have to check what technical events lead to key changes in terms of user experience. The fact that Webpagetest makes it so easy is awesome, I’m really thankful for this great tool. We all have to remember that we know best what is important for our users and when it is shown to them.
And that’s it. :)
I hope you enjoyed the article. Your feedback is welcome.
Side note At the time of writing there seems to be a bug in Webpagetest. The display of custom performance marks seems to work only when choosing Internet Explorer 11 or Firefox nightly as the used browser. I already filed an issue and it will hopefully be resolved soon.

Join 6.5k readers and learn something new every week with Web Weekly.

Frontend nerd with over ten years of experience, freelance dev, "Today I Learned" blogger, conference speaker, and Open Source maintainer.