Investigating INP issues
- Published at
- Updated at
- Reading time
- 3min
I've been doing some client performance work lately. It's a Next.js project, and it looks like Google's INP update has punished it. Organic search rankings are tanking.
I thought it would be a quick gig because there was a ton of low-hanging fruit. After fixing, waiting and constantly checking the Search Console (it takes a while until Googlebot recognizes improvements), things moved in the right direction, but fixing the obvious isn't enough.

Many "need improvement" URLs moved to "good" in May, but "good" URLs still don't make up the majority.

The main offender is the new INP metric, and that's no surprise. The site's built with a JS-heavy stack: many libraries, huge hydration data blocks, SVGs in React — you get the idea. A lot is going on in modern web development.
I still need to solve the INP issue, but I learned a few things.
After spending time in Lighthouse and the Chrome performance panel, I figured that the official Chrome extension might be worth a shot. Once you install it, you'll see some juicy performance metrics right away. Nice!
But opening the extension can be a bit cumbersome, especially when trying to nail down slow interactions. To tackle INP and unresponsiveness, you can't just run Lighthouse and call it a day. INP relies on real interactions; you must "do stuff" and measure.
Luckily, the extension has a solution to this problem — console logging.
I was surprised by the details logged to the console.
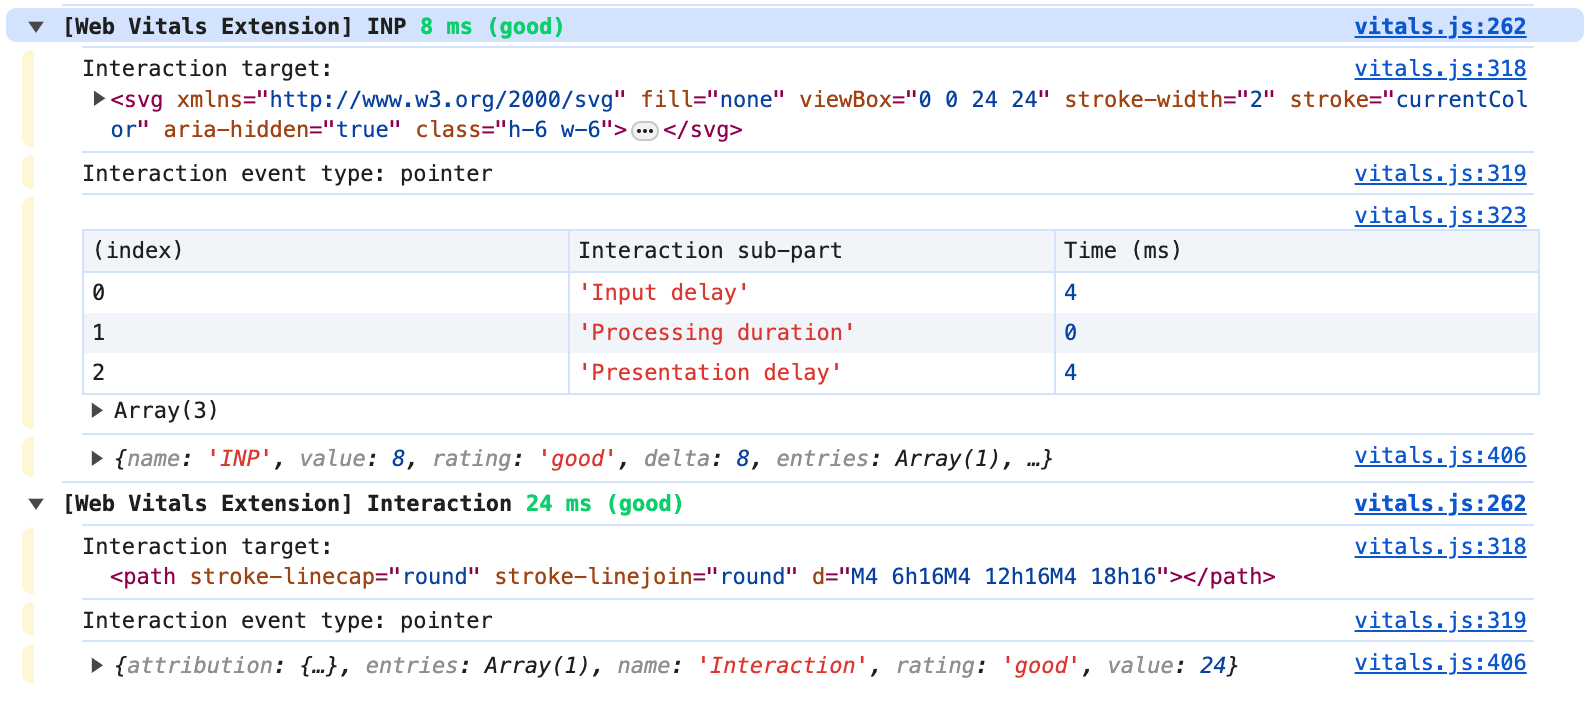
Interaction details, the user interaction target and type — all this info is right there in the console. But where's this data coming from?
Internally, the Chrome extension relies on the official Web Vitals package. And this one now comes with a new attribution module.
// Example from: https://web.dev/articles/find-slow-interactions-in-the-field

import {onINP} from 'web-vitals/attribution';

onINP(({name, value, rating, attribution}) => {
  console.log(name);         // 'INP'
  console.log(value);        // 512
  console.log(rating);       // 'poor'
  console.dir(attribution);  // Attribution data
});
As far as I can see, web-vitals uses PerformanceObserver magic to squeeze out and format the performance and attribution details. If you inspect the code, it's wild but good stuff.
// Example from: https://web.dev/articles/find-slow-interactions-in-the-field

import {onINP} from 'web-vitals/attribution';

onINP(({name, value, attribution}) => {
  const {processingDuration} = attribution; // 512.5

  // Get the longest script from LoAF covering `processingDuration`:
  const loaf = attribution.longAnimationFrameEntries.at(-1);
  const script = loaf?.scripts.sort((a, b) => b.duration - a.duration)[0];

  if (script) {
    // Get attribution for the long-running event handler:
    const {invokerType} = script;        // 'event-listener'
    const {invoker} = script;            // 'BUTTON#update.onclick'
    const {sourceURL} = script;          // 'https://example.com/app.js'
    const {sourceCharPosition} = script; // 83
    const {sourceFunctionName} = script; // 'update'
  }
});
You can see which script was handling which interactions, too. Great!
I could now set up some RUM monitoring to find the actual performance offender in my current project, but I hope to resolve the issue with some clicky-looky myself. Fingers crossed.
If you want to learn more, the Chrome developer relations team published some great materials:
Until then, I'll report back when I fixed the issues.

Join 6.5k readers and learn something new every week with Web Weekly.

Frontend nerd with over ten years of experience, freelance dev, "Today I Learned" blogger, conference speaker, and Open Source maintainer.